
















Findmykids data shows that U.S. children spent less time using their smartphones in their defined school zones in September 2026 than a year earlier. Average daily use in the school zone fell from 40.7 minutes to 34.7 minutes — a 14.8% decrease.
But children’s overall smartphone use barely changed. Total daily use remained at around six hours per day, suggesting that less phone use in the school zone did not translate into a comparable reduction in overall screen time.
The data also shows an important limitation: phone use in school zones was already declining in May, so the full September decrease cannot be attributed specifically to school phone restrictions.
- Published: October 2026
- Region: United States
- Age: Children aged 9–17 during the study period
- Data source: Findmykids aggregated and anonymized product data
Key Findings
- −14.8% less smartphone use in the school zone. Average daily use fell from 40.7 to 34.7 minutes between September 2025 and September 2026.
- −6 min/day in the school zone. Children spent approximately six fewer minutes per day using their smartphones in their defined school zones.
- 364.6 min/day (6h 5 min/day) total smartphone use in September 2026. Compared with 366.9 minutes per day in September 2025 — a difference that was not statistically significant.
- +1.2% change in use not matched to the school zone. Average use increased from 326.2 to 330.0 minutes per day, but the difference was not statistically significant.
- 56.0% had any recorded smartphone use in the school zone. Down from 62.9% in September 2025.
- −4.6 min/day school-zone use had already fallen in May. This means the full September decline cannot be attributed specifically to school phone restrictions.
Smartphone Use in the School Zone Fell 15%
The clearest change between September 2025 and September 2026 was recorded in the school zone.
Average daily smartphone use fell from 40.7 to 34.7 minutes — a 14.8% decrease, or about 6 minutes per day.
The difference was statistically significant, meaning the available data suggests that the decline is unlikely to be explained by random variation between the samples alone.
The decrease was also reflected in other measures:
- Median daily use: fell from 9.6 to 3.5 minutes.
- Children with any recorded school-zone smartphone use: fell from 62.9% to 56.0%.
Taken together, these figures show a consistent decline in smartphone use within children’s defined school zones in September 2026 compared with September 2025.
But Kids’ Total Smartphone Use Barely Changed
In September 2025, children in the dataset spent an average of 366.9 minutes (about 6 hours 7 minutes) per day on their smartphones. A year later, the figure was 364.6 minutes (about 6 hours 5 minutes). That amounts to a decrease of just 2.2 minutes per day, or 0.6%.
The difference was not statistically significant, so the available data does not provide enough evidence to conclude that children’s overall smartphone use changed meaningfully between September 2025 and September 2026.
In other words, total daily smartphone use remained broadly stable at around 6 hours per day.
The contrast with school-zone use is more revealing: children were using their smartphones substantially less in their defined school zones, while their overall daily smartphone use remained almost unchanged.
Phone Use Outside the School Zone Rose Slightly
One possibility is that children used their phones less in the school zone but compensated by spending more time on them elsewhere. The data does not provide strong evidence that this happened.
Average smartphone use that was not matched to the defined school zone increased from 326.2 to 330.0 minutes per day between September 2025 and September 2026. That’s an increase of 3.8 minutes per day, or 1.2%.
However, this difference was not statistically significant.
The study therefore does not provide reliable evidence that children compensated for reduced school-zone phone use by spending more time on their smartphones elsewhere.
There is also an important methodological distinction: “not matched to the school zone” does not necessarily mean that the child was physically outside school. It means only that the recorded use was not matched to the saved school location.
The September Decline Cannot Be Attributed Entirely to School Phone Restrictions
September shows a clear year-over-year decline in smartphone use in the school zone.
But September 2025 and September 2026 may differ for many reasons beyond school phone policies. Children’s behavior, the apps they use, and broader smartphone habits can all change over time.
To provide additional context, Findmykids also compared smartphone use during equivalent periods in May 2025 and May 2026.
School-zone smartphone use had already declined in May.
May 2025 → May 2026: −4.6 min/day
By September, the year-over-year decline was larger:
September 2025 → September 2026: −6.0 min/day
Using the May comparison as a reference for broader year-over-year change leaves an additional September difference of approximately −1.4 min/day.
This additional difference was not separately tested for statistical significance.
The data therefore supports a clear conclusion that smartphone use in the school zone declined year over year.
It does not, however, establish that the entire 14.8% September decline was caused by school phone restrictions.
Games and Video Saw the Biggest Declines in the School Zone
The type of smartphone activity taking place in the school zone also changed between September 2025 and September 2026.
• Gaming showed the largest decline, falling from 5.6 to 3.1 minutes per day — a decrease of approximately 45%.
• Video use also decreased, from 8.6 to 7.3 minutes per day, or about 15%.
• Communication app use fell from approximately 7.0 to 6.2 minutes per day, while entertainment and music/audio use also declined.
• Social media was the exception. Average use increased from 11.8 to 12.6 minutes per day, a rise of 0.8 minutes, or approximately 7%.
These category-level figures describe observed changes in average usage. Statistical significance was not calculated separately for individual app categories, so the differences should not be interpreted as independently confirmed effects.
Kids Spent More Time on Social Media Overall
The changes seen in individual app categories were not limited to the school zone. Across children’s total smartphone use, social media recorded the largest increase, while gaming showed the largest decline.
Average daily social media use increased by 20.6 minutes, while total gaming time fell by 17.5 minutes, from 51.5 to 34.0 minutes per day — a decrease of approximately 34%.
Video use also declined, from 91.0 to 84.9 minutes per day, or about 6.8%.
These shifts suggest that while children’s overall smartphone time remained remarkably stable, the way that time was distributed across different types of apps changed. Children were not necessarily spending less time on their phones overall — but they were spending that time differently.
As with the school-zone app categories, these are observed changes in averages. Statistical significance was not calculated separately for each app category.
Social Media Use Increased in Activity Not Matched to the School Zone
The largest observed increase in use not matched to the school zone was also social media.
Average daily social media use increased by approximately 19.9 minutes. Communication app use rose by 4.0 minutes, while gaming decreased by 14.9 minutes and video use fell by 4.8 minutes.
Again, these figures show changes in average usage rather than separately statistically confirmed effects. They also should not be interpreted as proof that this activity occurred physically outside school. The category represents usage that did not match the child’s saved school location.
What the Results Mean
The strongest finding is not simply that children used their phones less in the school zone. It is the contrast between school-zone use and total smartphone use.
Smartphone use in the school zone fell by 14.8%, while total smartphone use declined by just 0.6%. The first difference was statistically significant; the second was not.
This means the data provide evidence that where smartphone use occurred changed, while providing no reliable evidence of a meaningful change in children’s overall smartphone time.
At the same time, the May comparison makes it important not to interpret the September decline as a direct measurement of the effect of school phone restrictions.
The study identifies a year-over-year behavioral change. It does not establish a single cause for that change.
Methodology
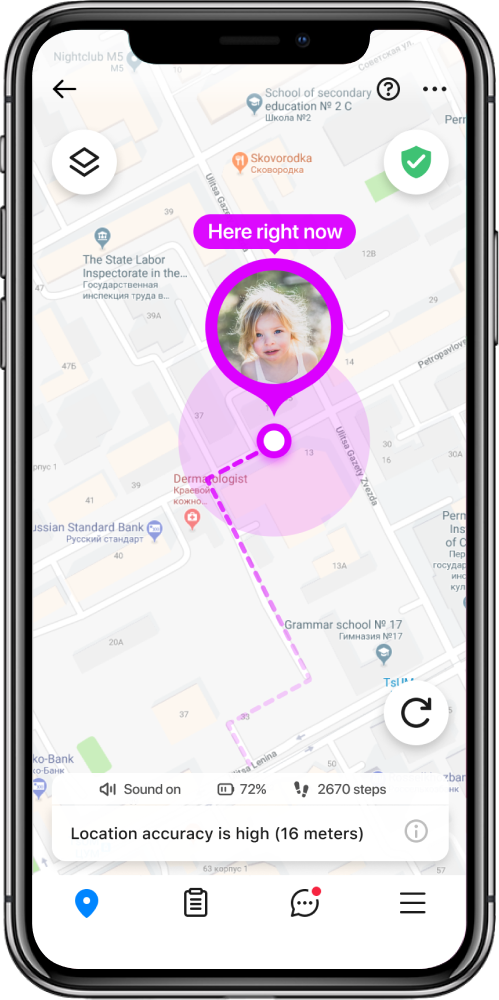
This study is based on anonymized data from the Findmykids app, a family safety app that combines parental controls and GPS tracking to help families protect the online and offline safety of children and other loved ones.
Population
- The analysis was designed to cover children aged 9–17 during the periods being compared.
- The underlying 2026 dataset includes children currently aged up to 18 in order to retain children who were 17 during the corresponding 2025 observation period.
Inclusion Criteria
- A child was included in the analysis when Findmykids data contained a saved location identified as their school.
- The school location had to have been created before the beginning of the observation period.
- Children also needed to have at least one recorded instance of app use during the selected days.
Analysis Period
- The study compares equivalent four-day periods from Tuesday through Friday in 2025 and 2026.
- The analysis includes comparable periods in May and September.
- The primary findings use the September comparison.
September Comparison
- September 2025: second analyzed week of September.
- September 2026: equivalent second analyzed week of September.
- The September analysis included 15,152 children in 2025 and 11,112 children in 2026.
- The 2026 sample was 26.7% smaller, so direct year-over-year comparisons should be interpreted with some caution because the composition of children included in each period may differ.
How Daily Use Was Calculated
Total smartphone use recorded during each four-day observation period was divided by the number of children included in the analysis and by four days.
The result represents average minutes of smartphone use per child per day.
What “School Zone” Means
- School-zone use refers to smartphone activity that coincided with the child’s saved school location in Findmykids.
- Use not matched to the school zone refers to smartphone activity that was not associated with that saved location.
- Importantly, activity not matched to the school zone does not necessarily prove that the child was physically outside school.
Statistical Significance
Where statistical testing was available, a difference is described as statistically significant when the data provides sufficient evidence to distinguish it from ordinary random variation between the samples.
The decline in average school-zone smartphone use between September 2025 and September 2026 was statistically significant (p < 0.001).
The changes in total smartphone use and use not matched to the school zone were not statistically significant.
Need More Data?
Need additional statistics for your story? We may be able to provide another age group, GEO, time period, or related aggregated Findmykids data.
Request Data
Проверьте электронный ящик